It’s hard enough to analyse mobile app marketing campaign data. An error in a single figure can lead to a significant distortion of the overall result.
These, in turn, can lead to incorrect planning of future campaigns and financial losses.
Learn how to get the data for analysis, make the process as transparent as possible, and ultimately get the data right in this article.
What is marketing analytics?
In a global sense, it’s a tool to determine if the right strategy and audience have chosen to attract traffic. There are several solutions for mobile analytics. The specific one you choose depends on the product you are promoting. You can use tracking platforms such as AppsFlyer and Adjust.

Principles of data analysis
- Relevancy. We need to understand what kind of metrics we should analyse. Let’s say whether the countries we are comparing are relevant. For example, Tier 1 and Tier 3 are not equal to each other inherently. And the traffic quality is different. That’s why it’s not appropriate to compare them.
- Context. You can’t compare data types that inherently have different properties. For example, the CPI of a campaign that optimises for instals vs. the CPI of a campaign that optimises for ROAS. The choice of data must depend on the end goals of the study. It is not always correct to compare different traffic sources with each other. Users within them have different behaviours.
- Seasonality. The researcher must understand the periods for which they are comparing data. The data he uses must correlate across periods to get reliable results.
How do I interpret the metrics?
When a researcher interprets metrics, he must understand what a particular metric indicates and how it relates to the others. Do not analyse all metrics at once. It is useless. It is better to consider each metric based on specific objectives. Here are some groups of metrics.
Marketing metrics
The most important metrics from which you can conclude the work of your app promotion agency are CTR (click-through rate), IR (install rate), and CR (conversion rate). These use to understand how good your traffic is and how effective your advertising campaign was.
Additional metrics (specifically in terms of interpretation) include the following:
- CPM – the price for every 1000 ad impressions;
- ER – how actively your audience interacts with your app;
- CPA – cost per action;
- ROAS is a measure of the profitability of advertising expenses.
There are situations when the survey results show that the campaign had no problems. But the changes were due to difficulties with the product, for example. In this case, you need to contact the advertiser and find out what has happened to the app.
If the problems occur at the beginning of the user’s interaction with the app, you can find the answer on the App Store or Google Play. Perhaps there have been some changes to the product description or visuals. And the app has become less appealing to download.
But even if everything is fine, sometimes it is in the conversion from installation to purchase that the figures slip. In this case, you have to admit your mistake. Perhaps, you started attracting an untargeted audience or some other problem occurred. It is necessary to sort it out.
As you can see, it is essential to have open contact with the advertiser’s representatives during the process. These will help to solve problems in time if they arise.
Product metrics
Product metrics include:
- DAU, WAU, MAU – day/week/month user activity metrics;
- Revenue;
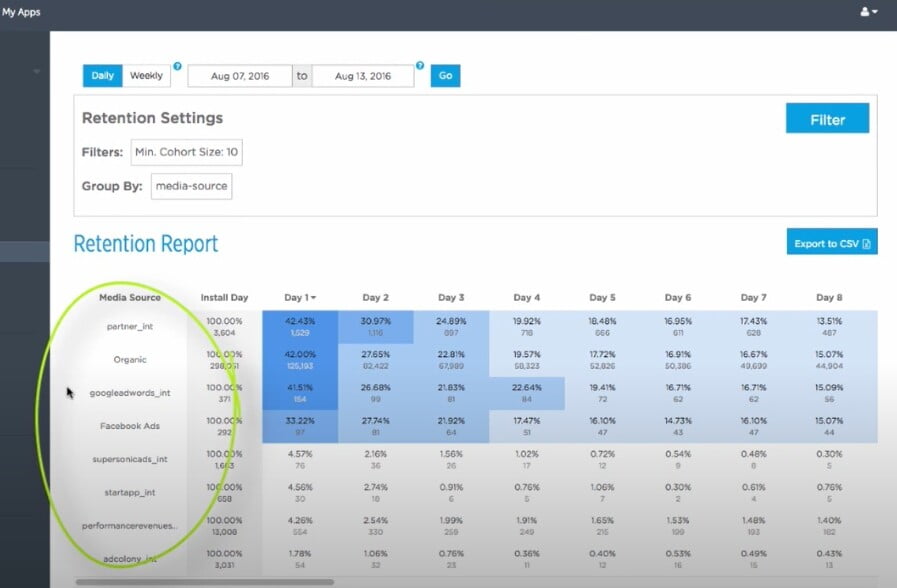
- RR – customer retention rate;
- CR – churn rate.
These metrics provide insight into the user experience. How many people have left the app, how many have come back, and how active they are.
The following metrics determine the financial success of a product and its value to the user:
- LTV – profit that the company receives for the whole time of working with a client;
- ARPU – revenue per user in a certain period;
- CAC – customer acquisition cost;
- ROI – return on Investment.
Organising the analysis
The first thing to do is to define the purpose of the analysis. Understand what you want to find out from it. Then move on to the strategy. There are several strategies for analysing marketing campaigns.
- Comparison of different segments of time;
- Analysis of changes in a particular metric over time;
- Analyse a campaign for variation in metrics – go from the general to the specific, looking for unusual jumps in metrics throughout a campaign.
Each metric is related to the other. One defines the other or at least influences it.
What do you need to check with the advertiser before starting the analysis?
First, ask for benchmarks. These are the metrics that the product had before launch. They help guide you in the early stages before your analytics come in.
Second, gather the most comprehensive information possible: metrics for specific traffic sources, GEOs, types of optimisation, period, and volumes. Try to make sure that the customer does not specify a wide CPI range, but a different price point for different types of campaigns.
If you are clear about your objectives, work through the metrics correctly and interpret the results accurately, you will have valuable information about the product and campaign. It will not only keep you from wasting money but also increase your profit.


